The read
Instagram is where this song lives: 106K reels on its audio page against 11.3K TikTok videos on the official sound, 9x as many. On TikTok it is a background bed, not a fan object: only 0.1% of 2.8K fan clips name the song, the artist or Anjuna in the caption or tags, and #justsinewaves has 0 videos.
106K
Instagram reels
on the audio page
11.3K
TikTok videos
on the official sound
17M
TikTok views
on 2.8K served clips
1.7M
YouTube views
10 uploads · 99.7% official
574.3K
Spotify monthly listeners
Martin Roth, all songs
Where it is used
Each of the 2.8K TikTok clips on the sound is read once and given one use (what the video is about), then ranked by the views those clips earned. Open a row for the hooks, hashtags and clips behind it.
23.4% of clips · median 687 · saved 0.9%·Opens withscenery / vibe only (302)no caption (229)
Tagged#sea (39)#travel (38)#nature (37)#summer (25)· 77 of 647 carry no hashtag


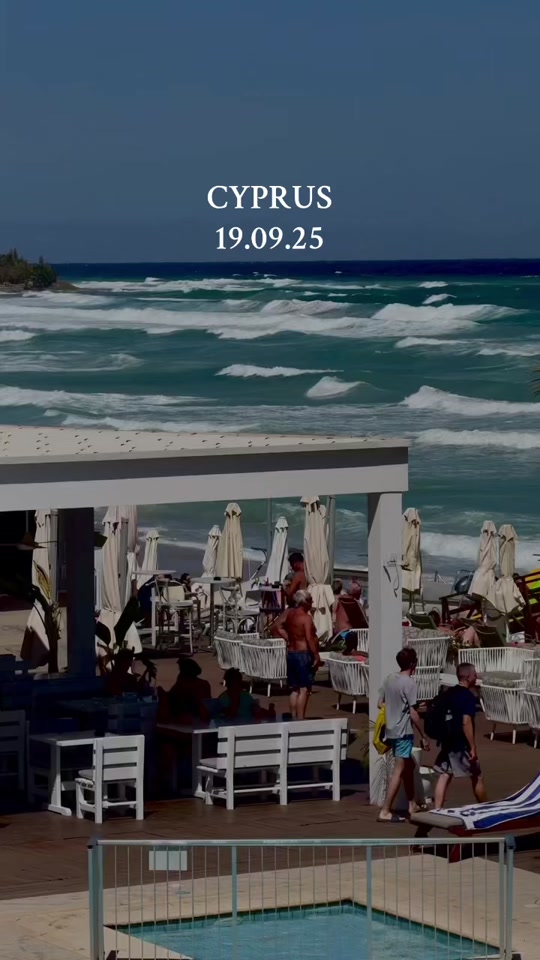

Why this differs from the Hashtags tab: a use is what the video is about; a hashtag is what the creator typed. #yoga is on 69 clips, of which 64 are yoga / movement, 4 are wellness / nervous system, 1 is fashion. Many travel clips carry no hashtag at all, so they rank higher here than in the tag table.
So what · The biggest use is travel / nature: 647 of 2.8K clips and 3.5M views. It is bought as a mood, not as a track: calm, slow, outdoors, the body.
Where it is trending
Caption language of the clips, the closest the data gets to geography.
1143 clips · 8.8M
192 clips · 1.1M
156 clips · 1.1M
141 clips · 762K
125 clips · 1.2M
74 clips · 314K
65 clips · 232K
53 clips · 128K
37 clips · 175K
556 of the clips have no caption or only emoji.
Instagram vs TikTok · what it is used for
Share of clips in each use: 36 Instagram reels from the audio page against 2.8K TikTok clips. The Instagram sample is small, so read the big gaps, not the small ones.
travel / nature36.1%23.4%
relationships / psychology8.3%3.8%
art / craft process8.3%7.3%
yoga / movement8.3%5.4%
wellness / nervous system5.6%4.4%
home / interiors5.6%2.6%
food2.8%1.3%
health / nutrition advice2.8%1.7%
■ Instagram■ TikTok
So what · On Instagram the song is even more of a travel bed: 36.1% of the sampled reels are travel or nature, against 23.4% of the TikTok read. A campaign that leads on Instagram should brief travel creators first.
Recurring hooks
How the caption frames the video, ranked by the median views of clips that use that frame. A hook that recurs and beats the median is the one resonating.
| Hook | Clips | Median views ↓ | Total views | Save rate | Mostly in | Best example |
|---|---|---|---|---|---|---|
| tutorial / how-to | 69 | 1.8K | 622K | 2.1% | yoga / movement (15), art / craft process (13) | |
| list / tips | 55 | 1.5K | 298K | 1.8% | business / coaching (9), travel / nature (8) | |
| question to viewer | 83 | 1.2K | 754K | 0.5% | travel / nature (17), spirituality / astrology (9) | |
| POV / relatable | 43 | 1.1K | 340K | 0.9% | relationships / psychology (6), travel / nature (5) | |
| advice / myth-busting | 233 | 1.1K | 3.2M | 0.9% | relationships / psychology (53), spirituality / astrology (45) | |
| product / service promo | 244 | 886 | 2.5M | 1.1% | fashion (33), beauty / skincare (33) | |
| scenery / vibe only | 503 | 744 | 3.7M | 0.6% | travel / nature (302), art / craft process (38) | |
| personal story | 313 | 715 | 1.8M | 1.4% | art / craft process (59), travel / nature (56) | |
| no caption | 1221 | 584 | 4.1M | 0.8% | travel / nature (229), art / craft process (52) |
So what · Across all clips, "tutorial / how-to" captions do best (median 1.8K views over 69 clips); "no caption" does worst (median 584). Read-clip median is 733 views.
Adoption on TikTok, month by month
Clips posted each month on the official sound, as TikTok serves them. Last three full months vs the three before: +15%.
14
9
16
55
124
103
162
127
79
98
151
197
326
269
155
137
180
213
161
168
19
So what · Adoption is up 15% over the last three full months against the three before (542 vs 472 served clips); the peak month was March 2026 with 326.
All takeaways
- Instagram is where this song lives: 106K reels on its audio page against 11.3K TikTok videos on the official sound, 9x as many.
- On TikTok it is a background bed, not a fan object: only 0.1% of 2.8K fan clips name the song, the artist or Anjuna in the caption or tags, and #justsinewaves has 0 videos.
- The biggest use is travel / nature: 647 of 2.8K clips and 3.5M views.
- Across all clips, "tutorial / how-to" captions do best (median 1.8K views over 69 clips); "no caption" does worst (median 584).
- Adoption is up 15% over the last three full months against the three before (542 vs 472 served clips); the peak month was March 2026 with 326.
- The official side is three @anjunachill posts in Jul–Sep 2025 (435K views); fans' 2.8K served clips carry 16.9M, so the official accounts hold 2.5% of the song's TikTok views.
- No TikTok page is built on the song: 141 of 2.6K creators used it more than once and none has it on more than 20% of its recent posts.
- Small accounts carry it: creators under 10K followers made 84% of fan clips and 40% of their views.
- Saves run at 0.9% of views (164K saves), ahead of shares at 0.5%: people keep these videos to come back to.
- None of the 8 other artists' songs Instagram groups with it has an official TikTok sound we could find; on Instagram it ranks 3 of 10 by reels.